Data Sources
Winnovative control can display data from a variety of data sources:
- DataTable
- DataView
- Array
- Collection
By default, for most of the chart types, the first string column from the data source is used to display the labels on the X Axis and the rest of the numeric columns are displayed as data series.
(This can be changed. Please take a look at the next samples to learn how.)
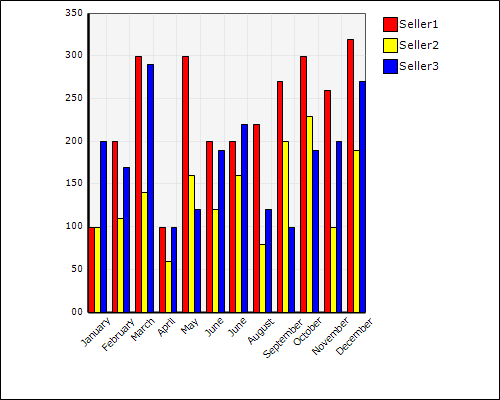
For example, the next chart, displays data from a DataTable that has the following columns:
- Labels (string)
- Date (DateTime)
- Seller1 (number)
- Seller2 (number)
- Seller3 (number)
The chart displays on the X Axis the values from the column "Labels" and 3 data series ("Seller1", "Seller2", "Seller3"). The name of the columns are used as legend labels.
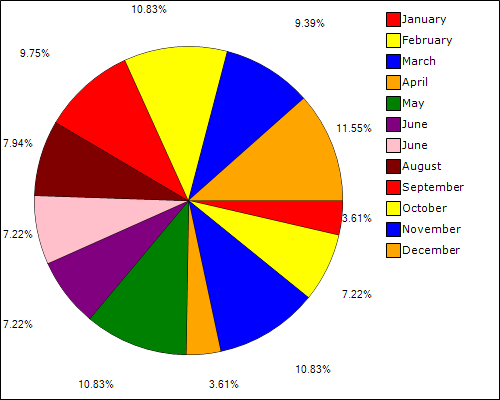
The pie charts are different. Pie charts (Pie, Doughnut, Pie3D, Doughnut3D) display data only from a numeric column ("Seller1" from the previous DataTable).
The first string column ("Labels") will be used to display the labels in the legend box.
See the following chart as example:
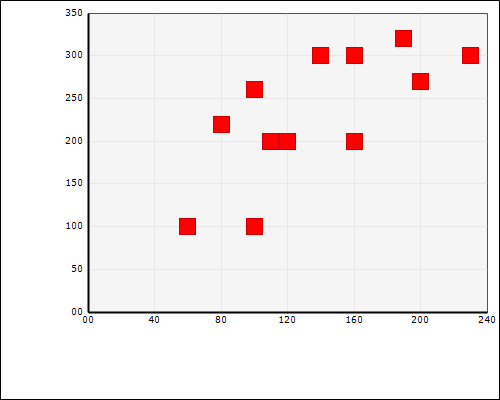
The scatter chart is another type of chart that has a different behaviour. This chart displays data from 2 numeric columns, one for axis X and one for axis Y, like in the following chart: